
Visualize Value Investing
Combine options chain market data and fundamental analysis. Reveal hidden patterns by synthesizing both short term and long term investing strategies.
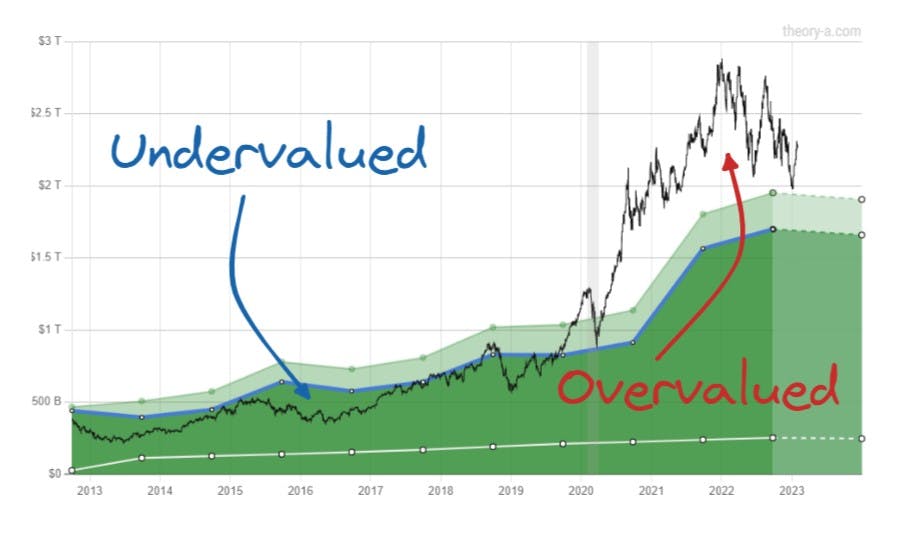
Hybrid Analysis
Overlay earnings, market cap, and the option chain matrix.
AAPL Market Cap vs EarningsOption Chain
Earnings
Estimate
Options
Log Scale
Show Negative
Quarterly
Loading...
Intuitive P/E Dislocations
Contextualize the Price to Earnings ratio by comparing it against its history.
3D Options Chain
Visualize options data and profit/loss charts in an intuitive 3D format.

Decile Breakdown
Contextualize values relative to all other values.