
Combining Fundamental Analysis and Options Data
An earnings overlay helps you explore a valuation. An options chain shows the prices of contracts tied to future outcomes. Putting them together helps you test an investment thesis and its timing.
This guide expands on the investing tutorial previously on our About page. The screenshots are historical illustrations, not current quotes or recommendations. Their exact capture dates were not recorded; contract expiration dates are identified where visible.
What does an earnings multiple tell you?
Imagine a business with $1.2 million in annual revenue and $1 million in total expenses. Its annual profit is $200,000. At a $3 million valuation, its price-to-earnings ratio (P/E) is 15: you are paying $15 for each dollar of annual earnings.
That is not a promise to recover your investment in 15 years. Earnings can change, profits may be reinvested, and accounting earnings differ from cash available to shareholders. A multiple is a way to frame a question, not a universal buying rule.
In Theory A, you can compare market capitalization with earnings multiplied by a selected P/E. Try several multiples and ask what would justify each one: growth, profitability, capital needs, debt, and uncertainty all matter.
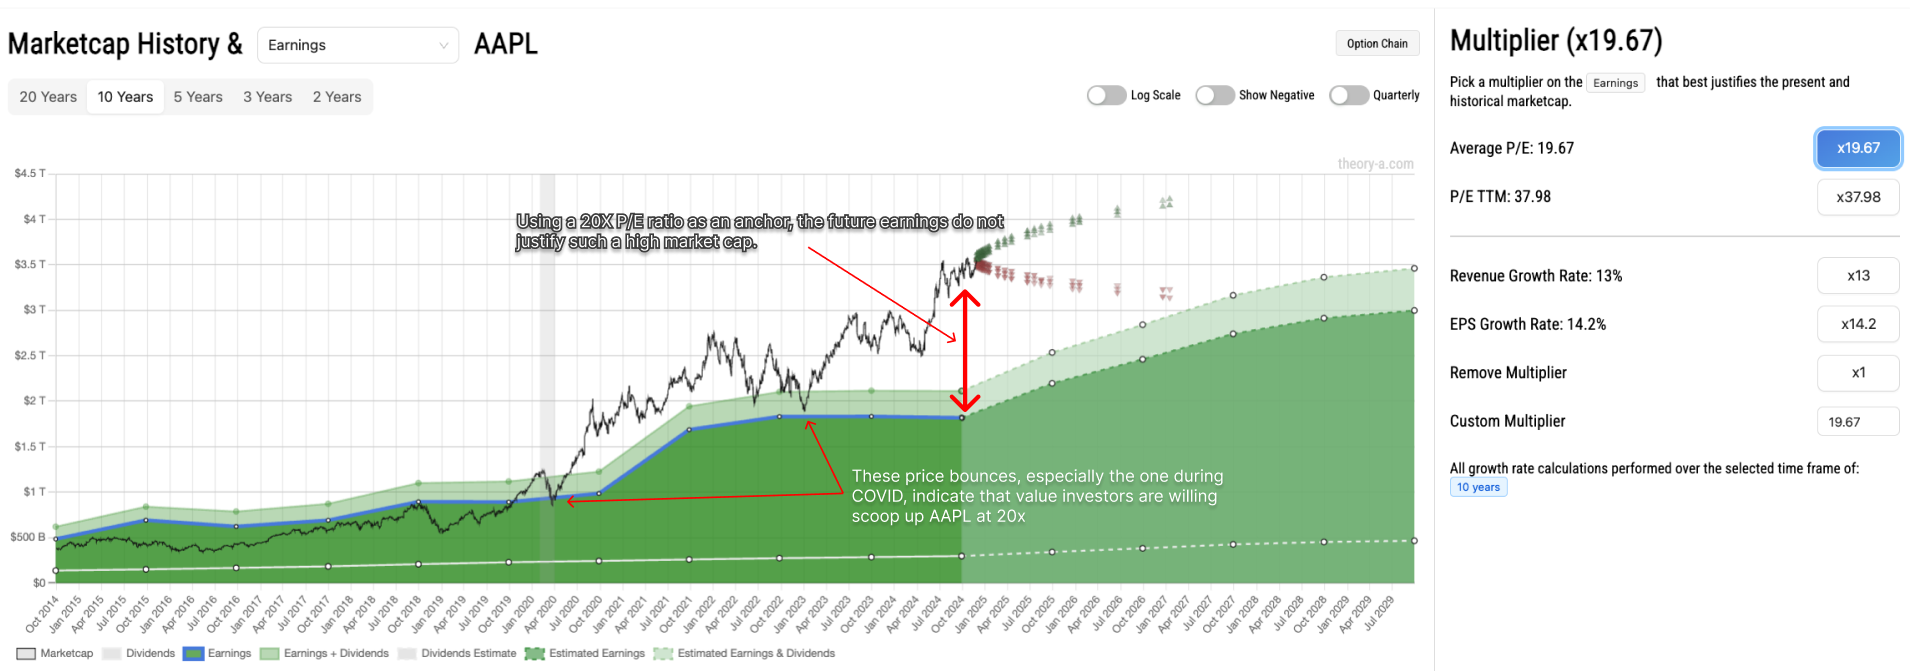
The gap between the price line and an earnings overlay depends on the chosen multiple. The estimated section also depends on forecasts that can be revised. A high valuation may reflect expectations of future growth; a chart alone cannot establish whether those expectations will be met. The further a thesis reaches into the future, the more room there is for assumptions to change.
Explore Apple in the stock analyzer →
Reading option breakevens
For a purchased call held to expiration, the breakeven is the strike plus the premium per share. For a purchased put, it is the strike minus the premium. These simple calculations exclude fees and assume the contract is held to expiration.
In the historical Tesla example below, a $325 put expiring April 17, 2025 was displayed with a premium of roughly $37 per share. Its expiration breakeven was therefore about $288. Before expiration, its value also depended on time remaining and implied volatility.
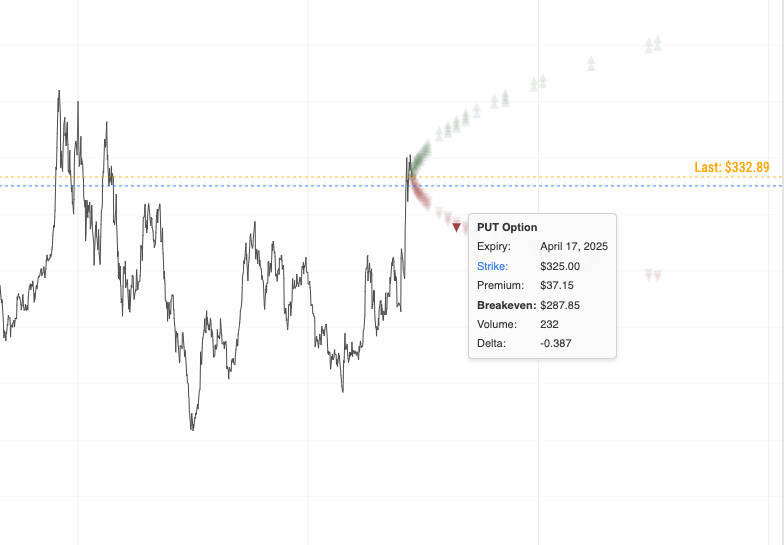
Plotting breakevens across expirations helps compare the movements needed to cover different premiums. The resulting shape is not a statistical confidence interval or a direct forecast. Quotes reflect volatility, time, supply, demand, and other factors.
Black–Scholes is one model for estimating theoretical option values, not a rule that determines all traded premiums. American-style options can be exercised early and are commonly modeled with methods that account for that feature. The Options Industry Council explains these distinctions in its introduction to option pricing models.
A long straddle buys a call and put at the same strike and expiration. At expiration, the stock must move beyond the strike by more than the combined premium to earn a profit before fees. Before then, both volatility and time decay affect its value. Selling the straddle reverses the payoff and introduces substantial loss exposure; collecting a premium does not ensure a profit. See the OIC’s straddle payoff explanation.
Explore Tesla’s options chain →
Combining fundamentals and options
Start with a business scenario, then examine how different instruments behave if it unfolds. For example, what if earnings grow more slowly than expected, or the market assigns a lower multiple even as earnings rise?
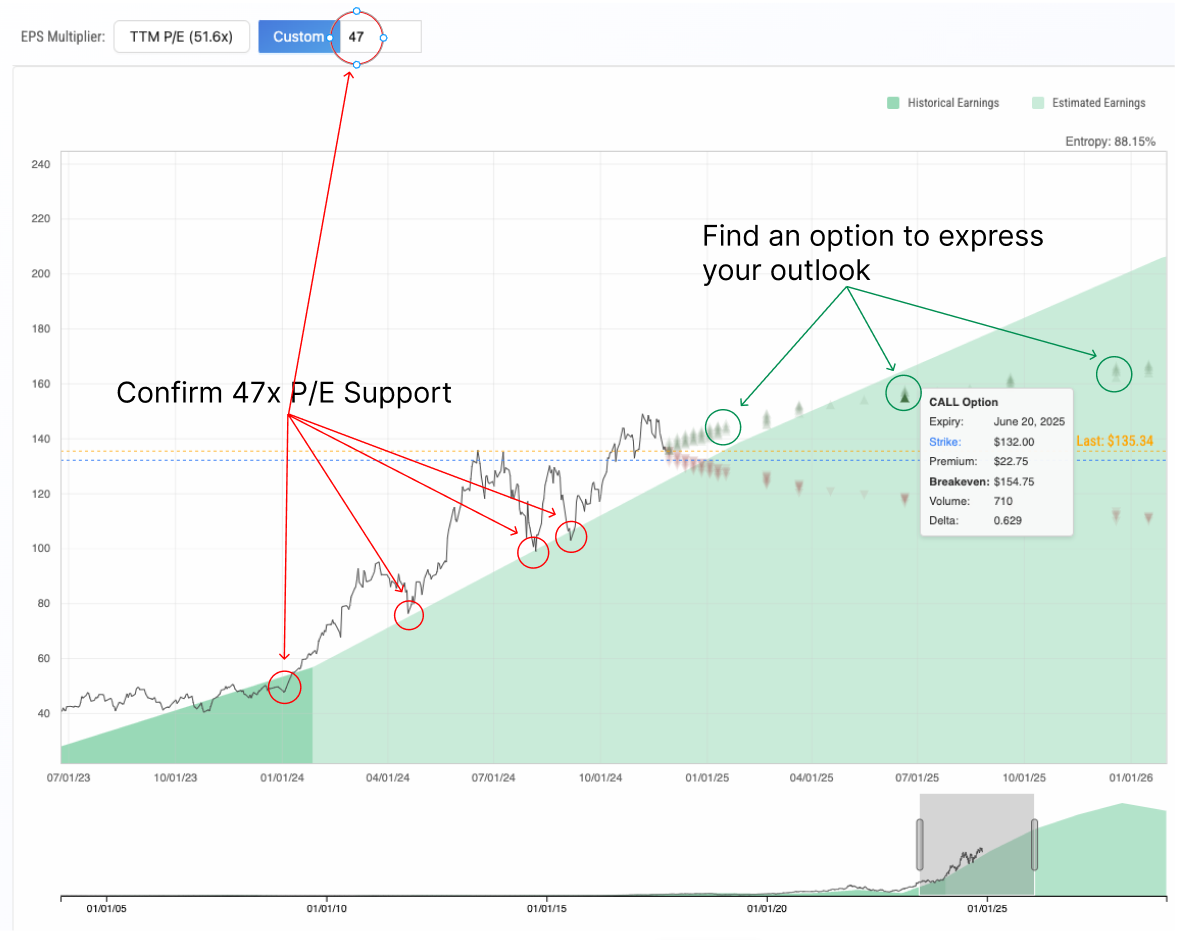
- Separate reported earnings from analyst estimates and your own projections.
- Compare several growth and valuation assumptions, including a downside scenario.
- Match the time horizon of your thesis to the expirations you are examining.
- Compare the payoff, maximum loss, and capital required for each position.
Explore Nvidia in the stock analyzer →
Comparing shares with long-term options
Long-term options, often called LEAPS, can provide exposure with a smaller initial outlay than buying shares. But $1,000 in calls is not automatically equivalent to $5,000 in stock. Exposure depends on the number of contracts, the contract multiplier, and delta, which changes as the stock price, time, and volatility change.
A purchased option can lose its entire premium, including when a bullish view proves right too late. Shares and calls also differ in dividends, voting rights, and expiration. For the tradeoffs, read the OIC’s overview of LEAPS and their risks.
Educational examples only, not recommendations to buy or sell securities. Data and estimates can be incomplete or delayed. Read about our data and methodology and verify current quotes and contract terms with your broker before making a decision.