
The Inescapable Inequality of Exponential Growth

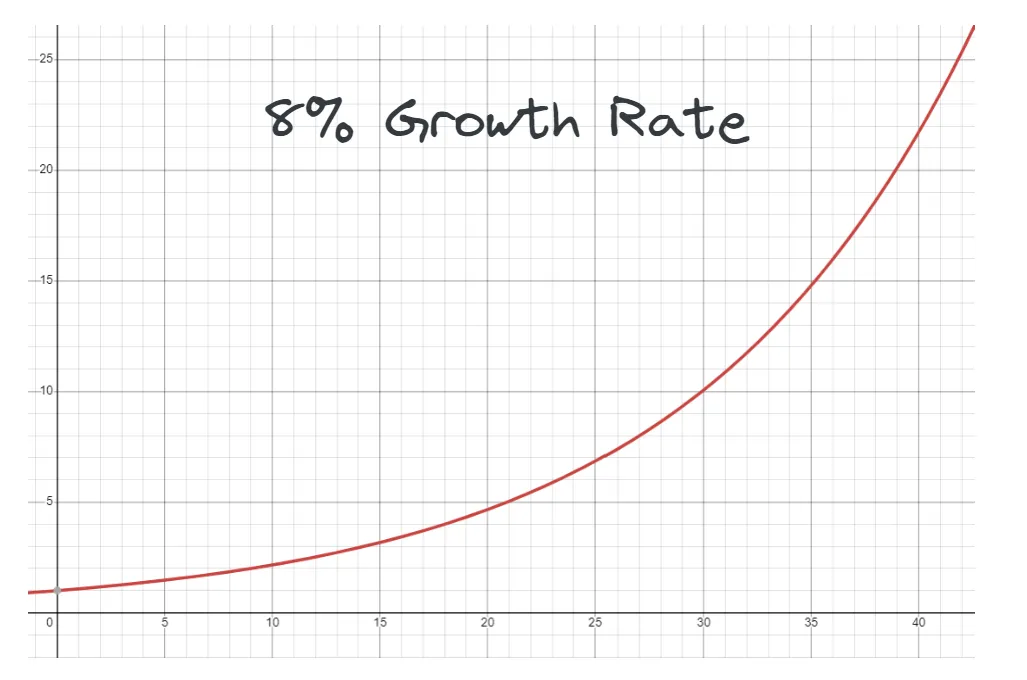
Most investors are familiar with exponential growth. At an 8% yearly growth rate, every single dollar invested will double in 10 years, quintuple in 20 years, and return more than 20 times the original investment after 40 years.
If you were to invest 10k, after 40 years it would be worth more than 200K.
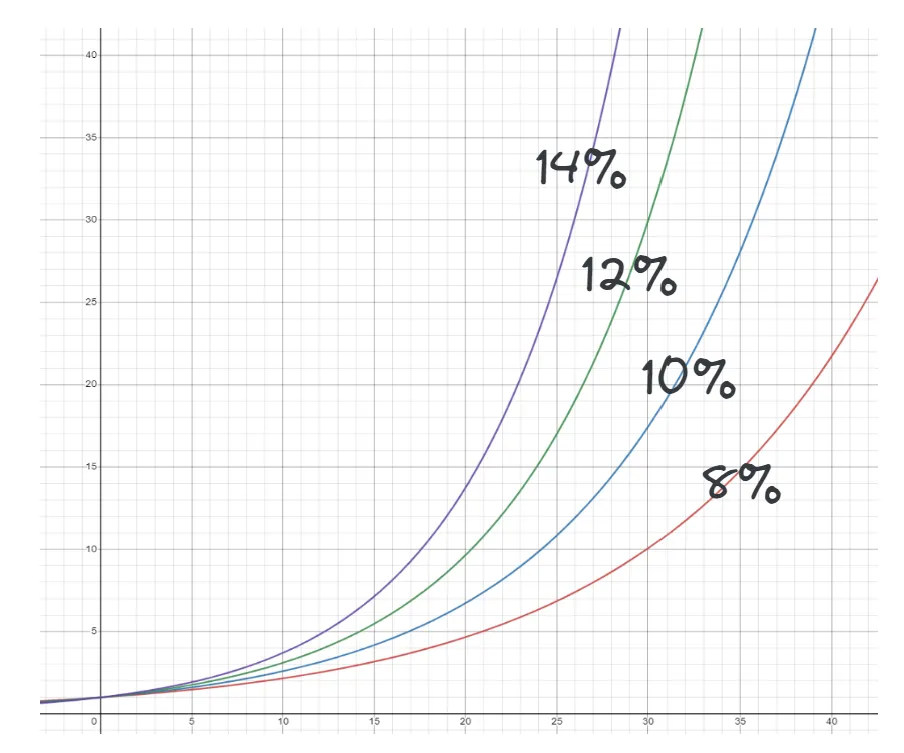
Even minor increments in the rate of compounding create large absolute differences over time.
That same 10k compounding at 10% after forty years would be 450k
At 12% it would be 930k.
At 14% it would be almost 1.9 million.
It’s clear that exponential growth is an amazing force. Einstein is reported to have said that “Compound interest is the eighth wonder of the world”.
However one of the ignored aspects of exponential growth is that it mathematically creates inequality.
Inequality as a Feature
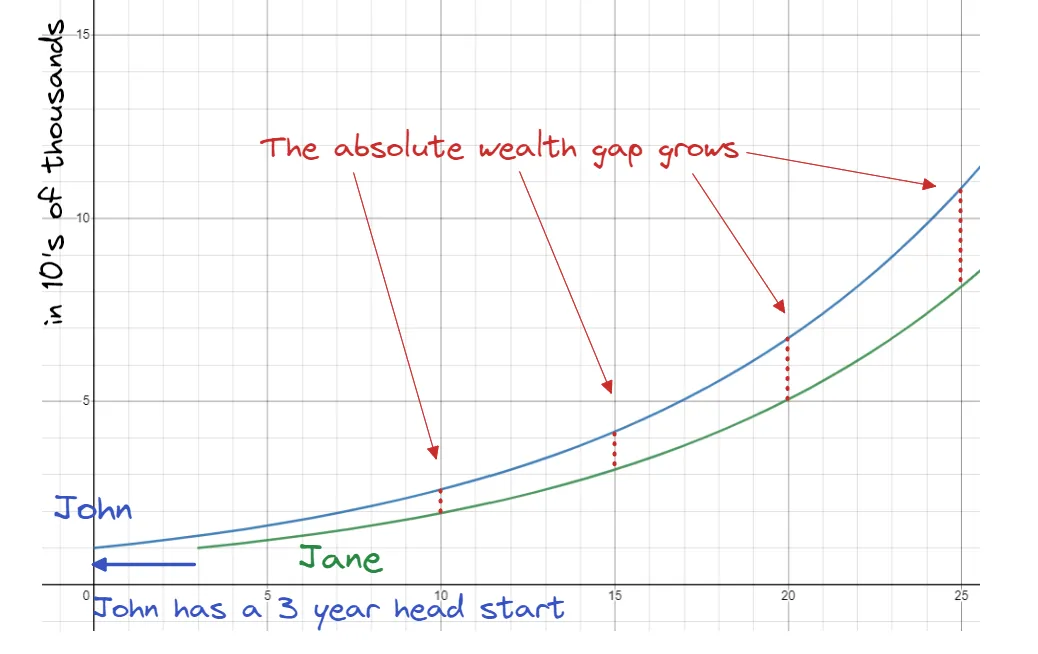
Let’s take two investors John and Jane, each investing 10k each. Both investors have access to a fund that consistently returns 10% each year.
John starts investing in 2020 and and Jane starts investing in 2023, just 3 years later.
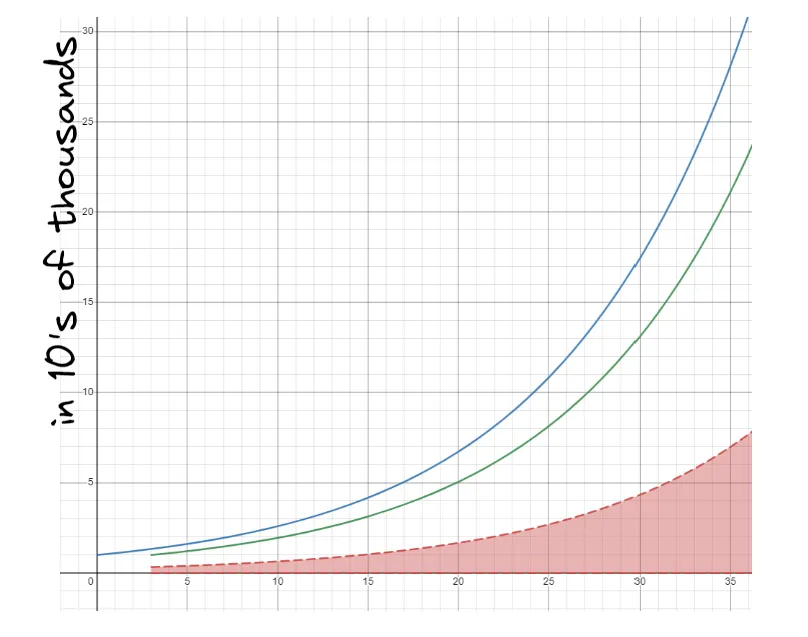
In 2030
John has (10000 * 1.10 ^ 10) or $25,937
Jane has (10000 * 1.10 ^ 7) or $19,487
John has $6450 more
In 2040
John has (10000 * 1.10 ^ 20) or $67,274
Jane has (10000 * 1.10 ^ 17) or $50,544
John has $16,730 more
Notice what’s happening?
John and Jane use the exact same investing strategy but John’s absolute level of wealth is growing faster than Jane’s even though Jane is always exactly behind by 3 years.
That is, their wealth difference across time is consistent but their wealth difference at any present moment increases.
If you plotted their growth rates you’d see that Jane’s wealth over time is the same as John’s, just shifted over by 3 years. (The green line shifted to the left 3 units would be the same as the blue line)
So while their wealth is growing exponentially, their wealth inequality is also growing exponentially.
Their difference in wealth can be calculated with the formula.
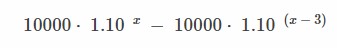
They both start with 10k, and they both compound at 10%. The only difference is a 3 year gap.
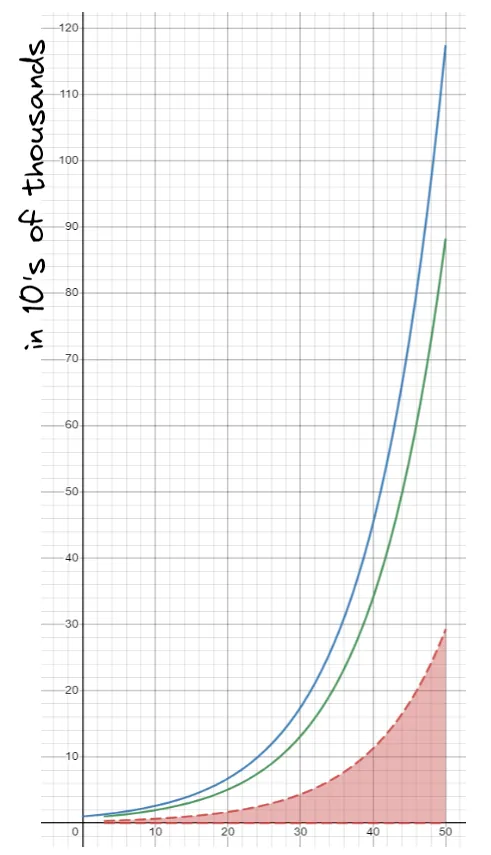
If you plotted the red dotted gaps between the green and blue line over time, the chart would look like this. Notice that the red chart is also an exponential curve.
This is what their wealth would look like after 50 years.
Investing is Not a Race
Exponential growth is a double-edged sword.
It is an almost magical way of building wealth as an individual but comes at the cost of a sense of increasing inequality.
Investors that treat money like a race or a social status symbol will get frustrated that they can never catch up to their friends or colleagues that started earlier. The feeling of unfairness is further exacerbated by other differences like lucky investments or family wealth.
This kind of frustration can lead to dangerous all-in YOLO bets because of a strong urge to catch up to and exceed others.
It can be dispiriting to realize that there are going to be people who not only have more money but will have greater and greater amounts of money even if you are both applying the same strategies.
However inequality is just the byproduct of exponential growth, not a reflection of personal worth or success. Understanding this can help us accept the best moves we can make for ourselves as individuals instead of letting resentment build in a ways that result in disastrous greed driven decisions .