
Why Theory A?
Published: July 7, 2022
A useful investing tool should help you see something you couldn’t see before. Our guide shows how Theory A combines business results and options. This is why we built it that way.
We started with two questions:
- Could we build a “bicycle for the mind” for investors?
- Could we make it easier to find ideas beyond the stocks everyone is talking about?
A Bicycle for the (Investing) Mind
Steve Jobs once described a study comparing how much energy different species used to travel a given distance.
The condor ranked highly. Humans on foot were somewhere in the middle.
Put a human on a bicycle, and the result changed dramatically.
And it made a really big impression on me that we humans are tool builders and we can fashion tools that amplify these inherent abilities that we have to spectacular magnitudes and so for me a computer has always been a bicycle of the mind, something that takes us far beyond our inherent abilities.
A bicycle changes where you can go. A good computer tool can change the questions you can explore.
That is the standard we want an investing tool to meet.
Many screeners make you fill out dropdowns before showing anything useful. Bret Victor describes interfaces that make people “beg the graphic for every scrap of information” .
You spend your attention operating the tool when you wanted to study the business.
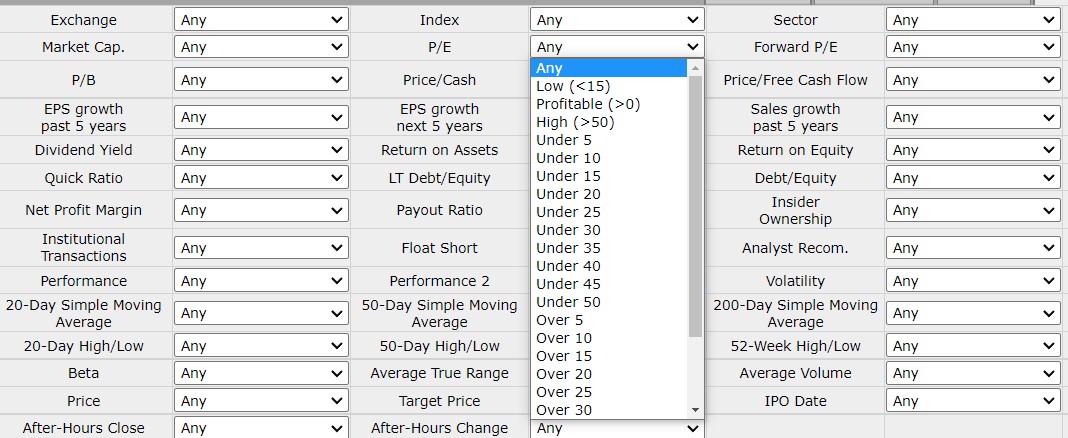
Is a P/E of 30 high? Is 10 low? A box asking you to enter a number assumes you already know what you’re looking for. Often, you need to see the range before choosing.
The essence of data graphics is visual comparisons. An excellent graphic offers its information generously and eagerly, encouraging the reader to answer wide-ranging comparative questions at a glance. An excellent interactive graphic offers opportunities to explore the data space more precisely, to slice and filter the data, to see the data from specific perspectives. Interactivity should not be used as a barrier to information.
Now look at the distribution below:
Each value sits beside others. You can see which P/E ratios are relatively high or low before deciding where to look. The comparison gives the number context.
The screener controls use the same idea.

We group values into deciles: ten groups ranked from one end of the range to the other. That lets you select a part of the market without first memorizing a cutoff for every metric.
The table updates as you choose. Each click shows you what your choice did.
A fixed list of filters works well when you know exactly what you want. When you’re still exploring, seeing the results as you go helps you decide what to try next.
The aim is to make unfamiliar companies easier to explore.
Meme Stock Momentum
Better tools can also widen the set of companies you consider.
A familiar stock is easier to think about than an unfamiliar one. That gives the companies in your news feed a head start.
Familiarity can feel reassuring even when the investment is risky.
The more often a name appears in conversations and headlines, the easier it is to mistake recognition for understanding.
You may know the ticker long before you know how the company makes money.
There is a social pull too. Buying a stock your friends recognize is easier to explain than buying one they have never heard of.
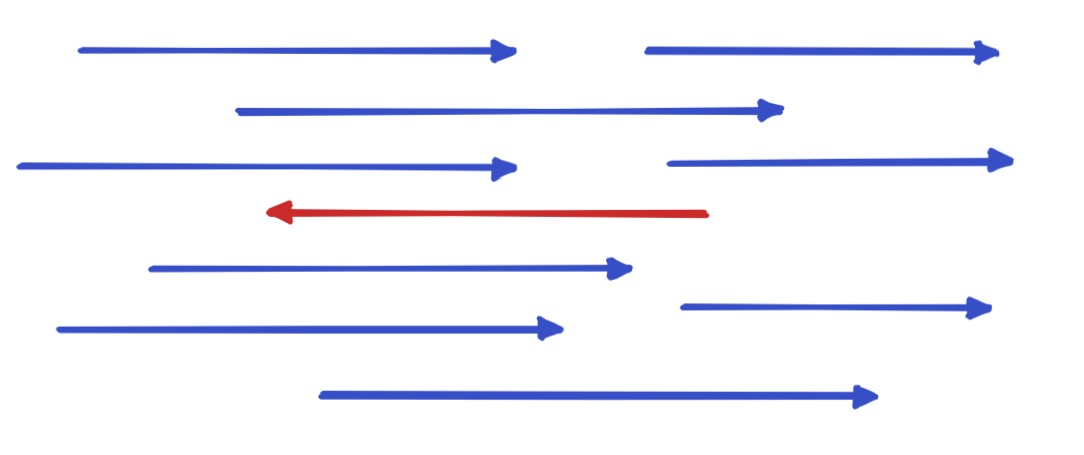
Being wrong alongside everyone else can feel less uncomfortable than being wrong alone.
That comfort does not reduce the money at risk. A popular investment can still be expensive or volatile.
Theory A should make it easier to investigate an idea for yourself: compare the business, its price, and what would have to happen for the investment to work.
Value investing can start with that ordinary question: what am I getting for the price I pay?
Use the market’s opinion as something to examine.
Follow our work on Twitter .