
GuruFocus alternative
The Peter Lynch chart, at the P/E that fits the stock.
Draw a stock’s earnings line at 15×, at its own average P/E or at any multiple you choose, across up to 30 years, free.
GuruFocus’s Peter Lynch chart plots a stock’s price against its earnings at a P/E of 15. Theory A, built to visualize value investing, draws the same comparison for about 5,900 US stocks. It starts the line at the stock’s own average P/E, and puts analyst estimates and option breakevens on the same chart.
Chart Nike free →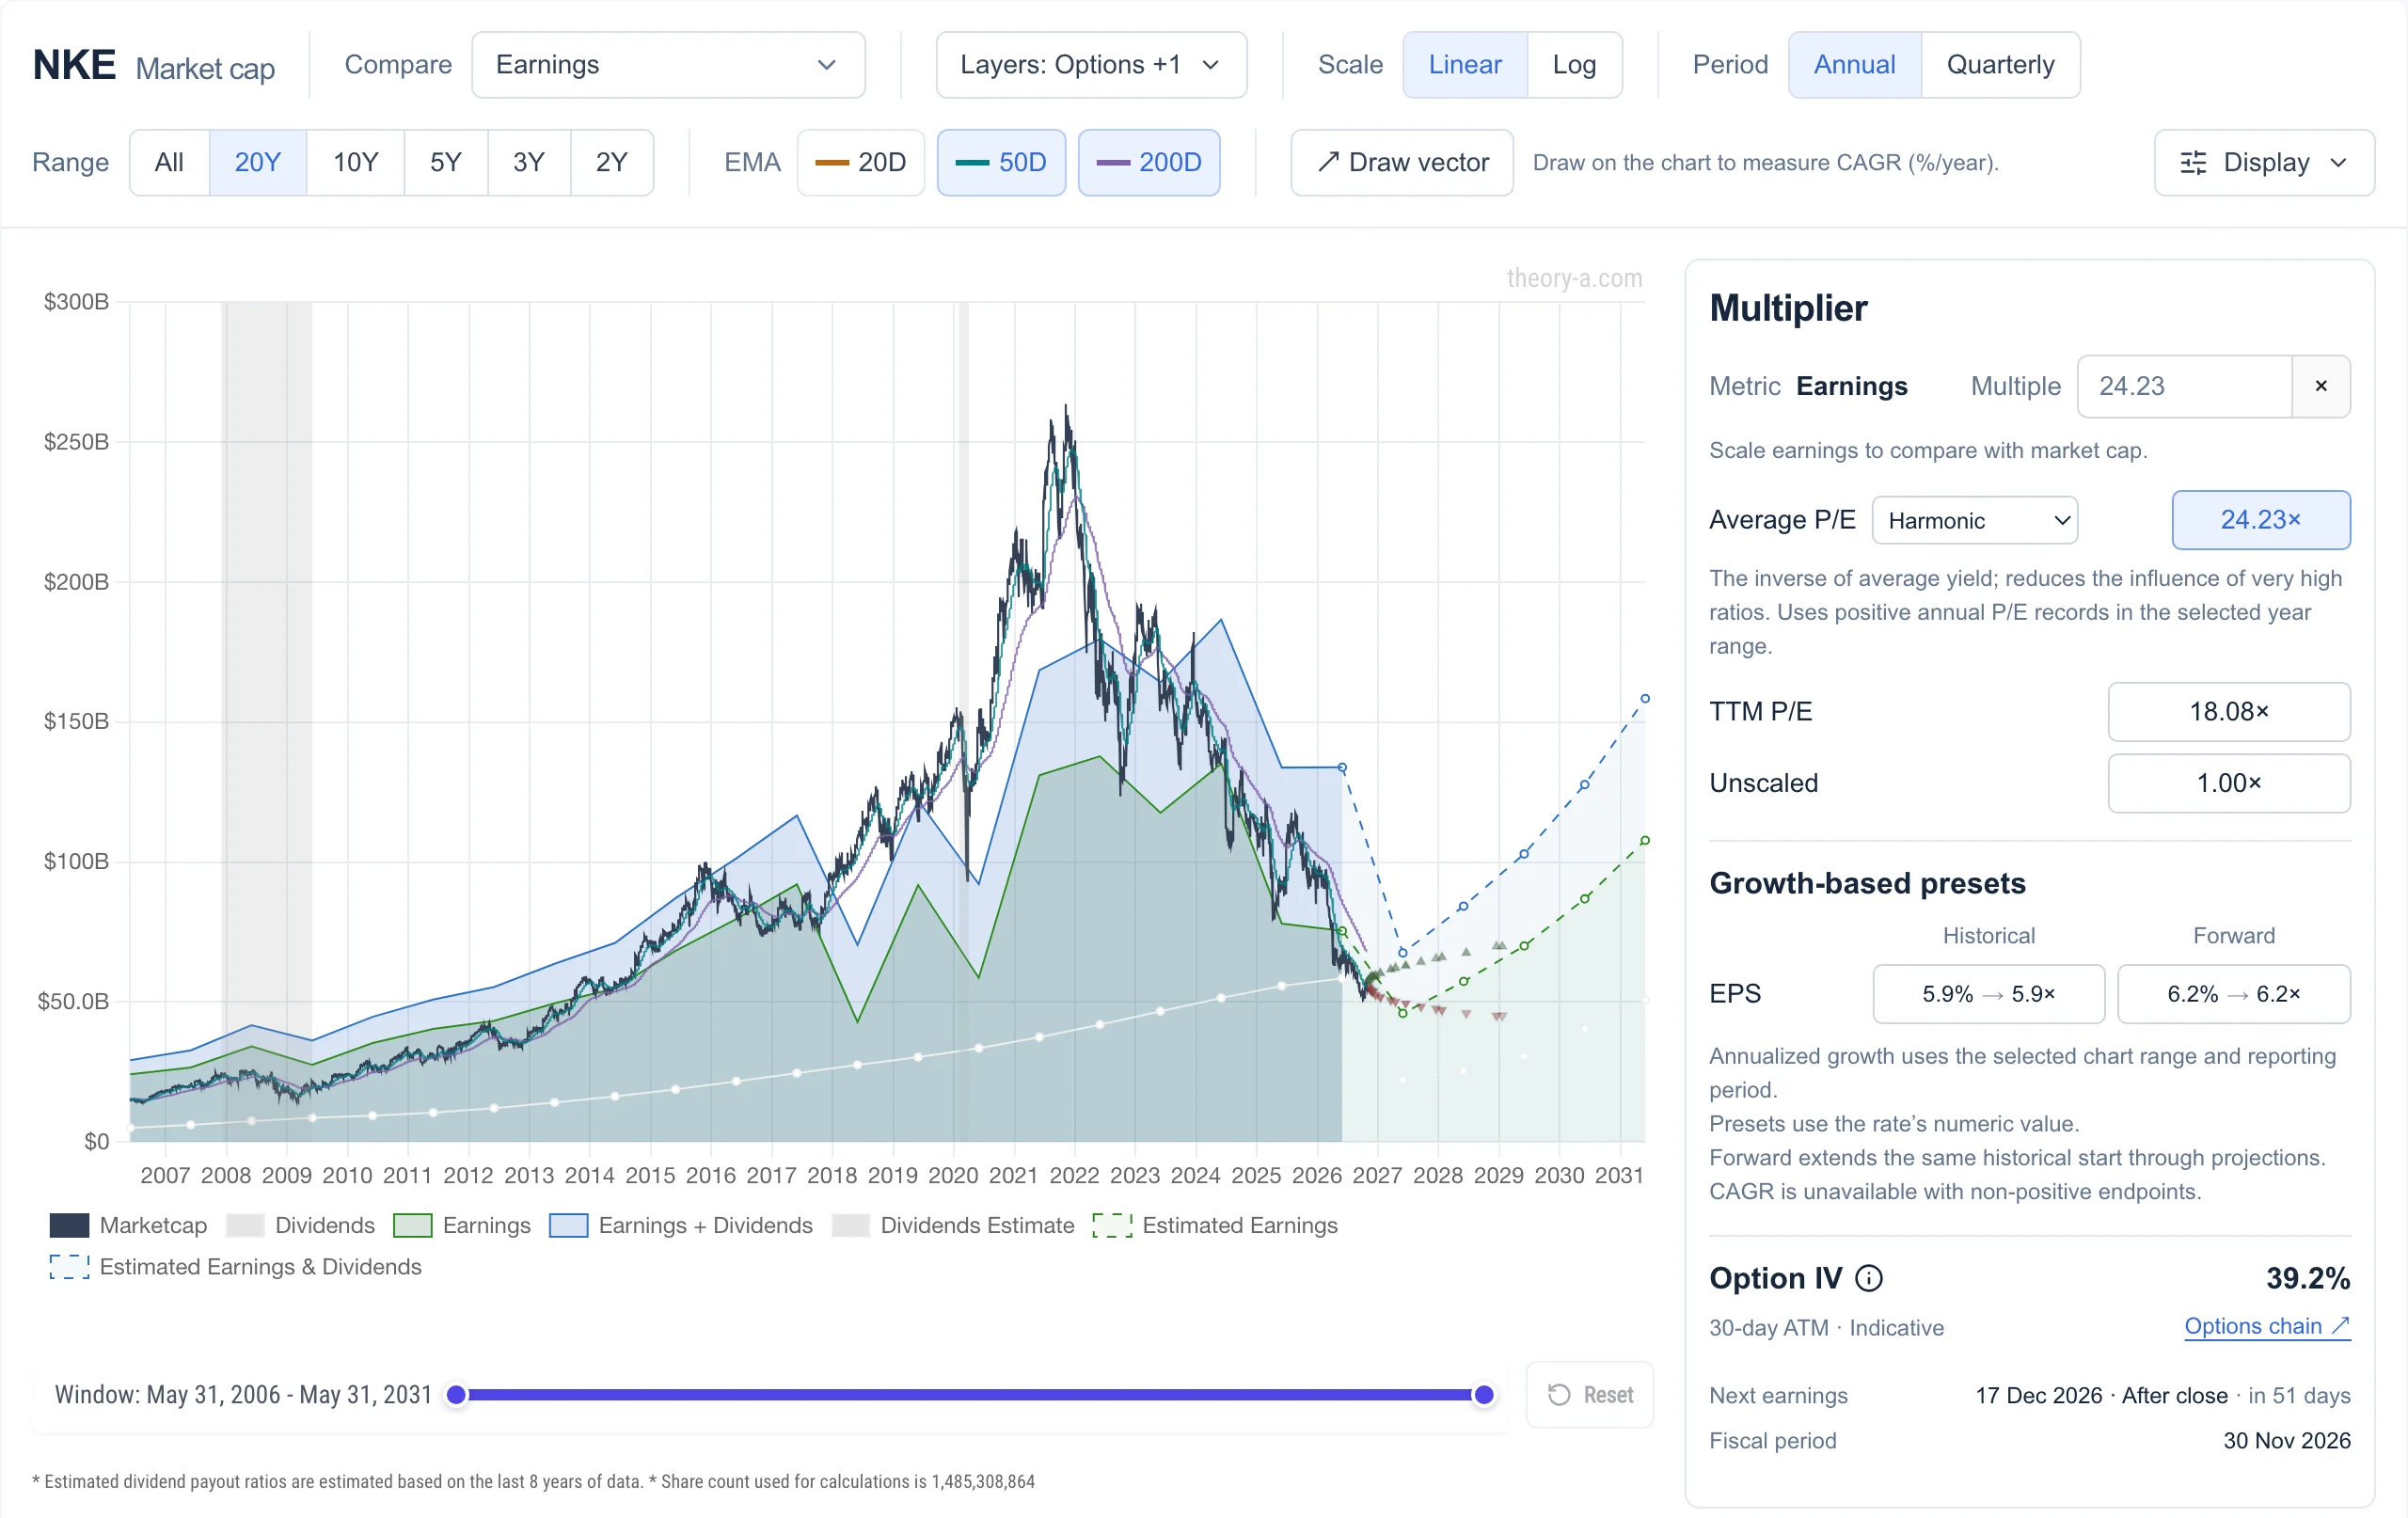 View full-size chart
If you know the Peter Lynch chart, you know this one
Each part of the Peter Lynch chart has a counterpart on the Theory A analyze page, which also plots option breakevens to the right of today.
| In the Peter Lynch chart | In Theory A |
|---|---|
| Price line | Market cap line, with 20, 50 and 200-day moving averages |
| Earnings line at a P/E of 15, or one you choose | Green earnings area at any multiple, starting at the stock’s own average P/E |
| 10-year median P/E line | Average P/E over the visible years: arithmetic, geometric, harmonic, median or least squares |
| Projected earnings from analyst estimates | Analyst estimates drawn as dashed lines for the next few years |
The biggest difference is where the line starts. A fixed 15× line marks any company the market has always paid a premium for as expensive. Starting at the stock’s own average P/E asks a narrower question: is it expensive compared with its own history? You can still type 15 to see Lynch’s line.
Theory A also plots market cap against total earnings rather than share price against earnings per share. The shape is the same, but buybacks show up as earnings per share growing faster than total earnings. And it uses reported net income, so one-off charges appear as dips.
GuruFocus and Theory A compared
GuruFocus is a broad research site built around what well-known investors own. Theory A is narrower: it puts the price, the business and the options market on one chart.
| Feature | Theory A | GuruFocus |
|---|---|---|
| Price vs earnings chart | Earnings × any multiple, starting at the stock’s own average P/E | Peter Lynch chart: earnings × 15 or a P/E you choose |
| Fair value | No house estimate: you set the multiple and see what today’s price assumes | GF Value line, from historical multiples, past returns and growth, and estimates |
| Scores | A decile rank on each metric among about 5,900 US stocks | GF Score from 0 to 100 |
| Screener | 36 free metrics with decile rankings | All-in-One Screener with hundreds of filters |
| Investor tracking | Not offered | Guru 13F portfolios and insider trades |
| Options | Option chain with live Greeks, and breakevens on the earnings chart | Gurus’ option holdings from 13F filings |
| Coverage | US, mainland China and Hong Kong stocks | Global |
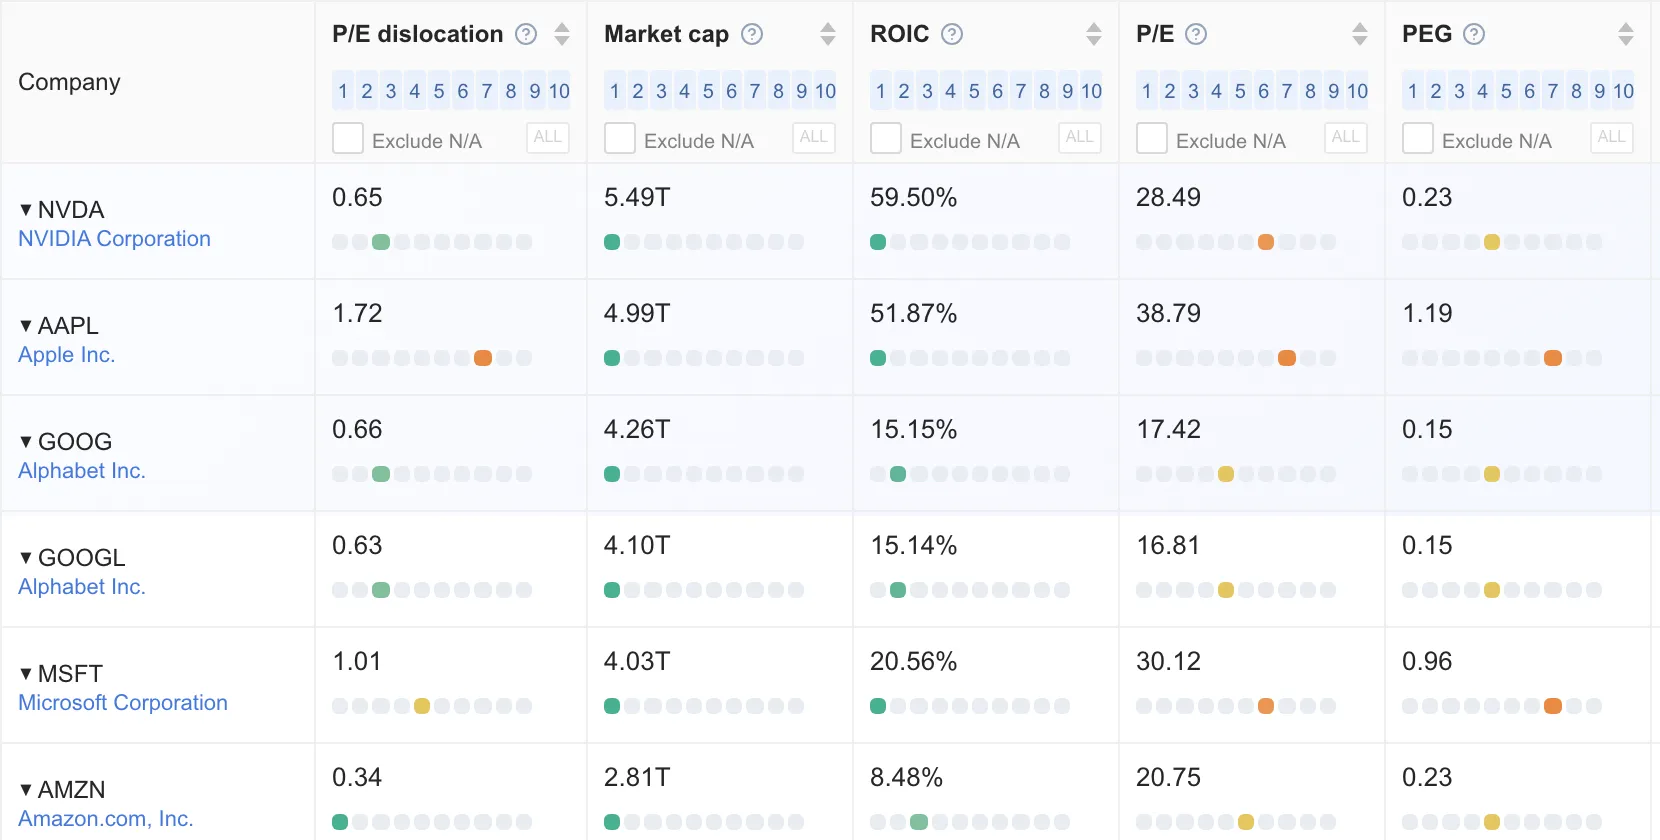
Every metric ranked against every stock
Instead of one combined score, the screener places each metric in a decile among about 5,900 US stocks, so you can see where a P/E sits among every other stock’s. One of those metrics compares each stock’s P/E with its own history.
Which tool fits you
- GuruFocus, if you want to follow what well-known investors and company insiders are buying, need global coverage, or want a house fair-value estimate and a screener with hundreds of filters.
- Theory A, if you want the earnings chart set to each stock’s own history, a decile rank for every metric, and option breakevens on the same chart as the business.
Draw Lynch’s line yourself
Open Nike on the analyze page and type 15 into the multiple box to draw the Peter Lynch line. Then pick an average P/E and compare the two. The earnings chart needs no account. See what Premium adds.
Open Nike in the analyzer →GuruFocus, GF Value, GF Score, FAST Graphs, Macrotrends, Simply Wall St and Stock Rover are trademarks of their respective owners. Theory A is not affiliated with or endorsed by any of them. Theory A is a research tool and does not provide investment advice.