
Stock Rover alternative
See the price against the business, not just the metrics.
Screen about 5,900 US stocks with each metric ranked by decile, then chart any of them against its earnings at its own average P/E, free.
Stock Rover is built for deep screening and portfolio analytics across North American stocks and funds. Theory A, built to visualize value investing, is narrower: it puts a company’s price, its earnings and the options market on one chart, and ranks each screening metric against every other US stock.
Chart Microsoft free →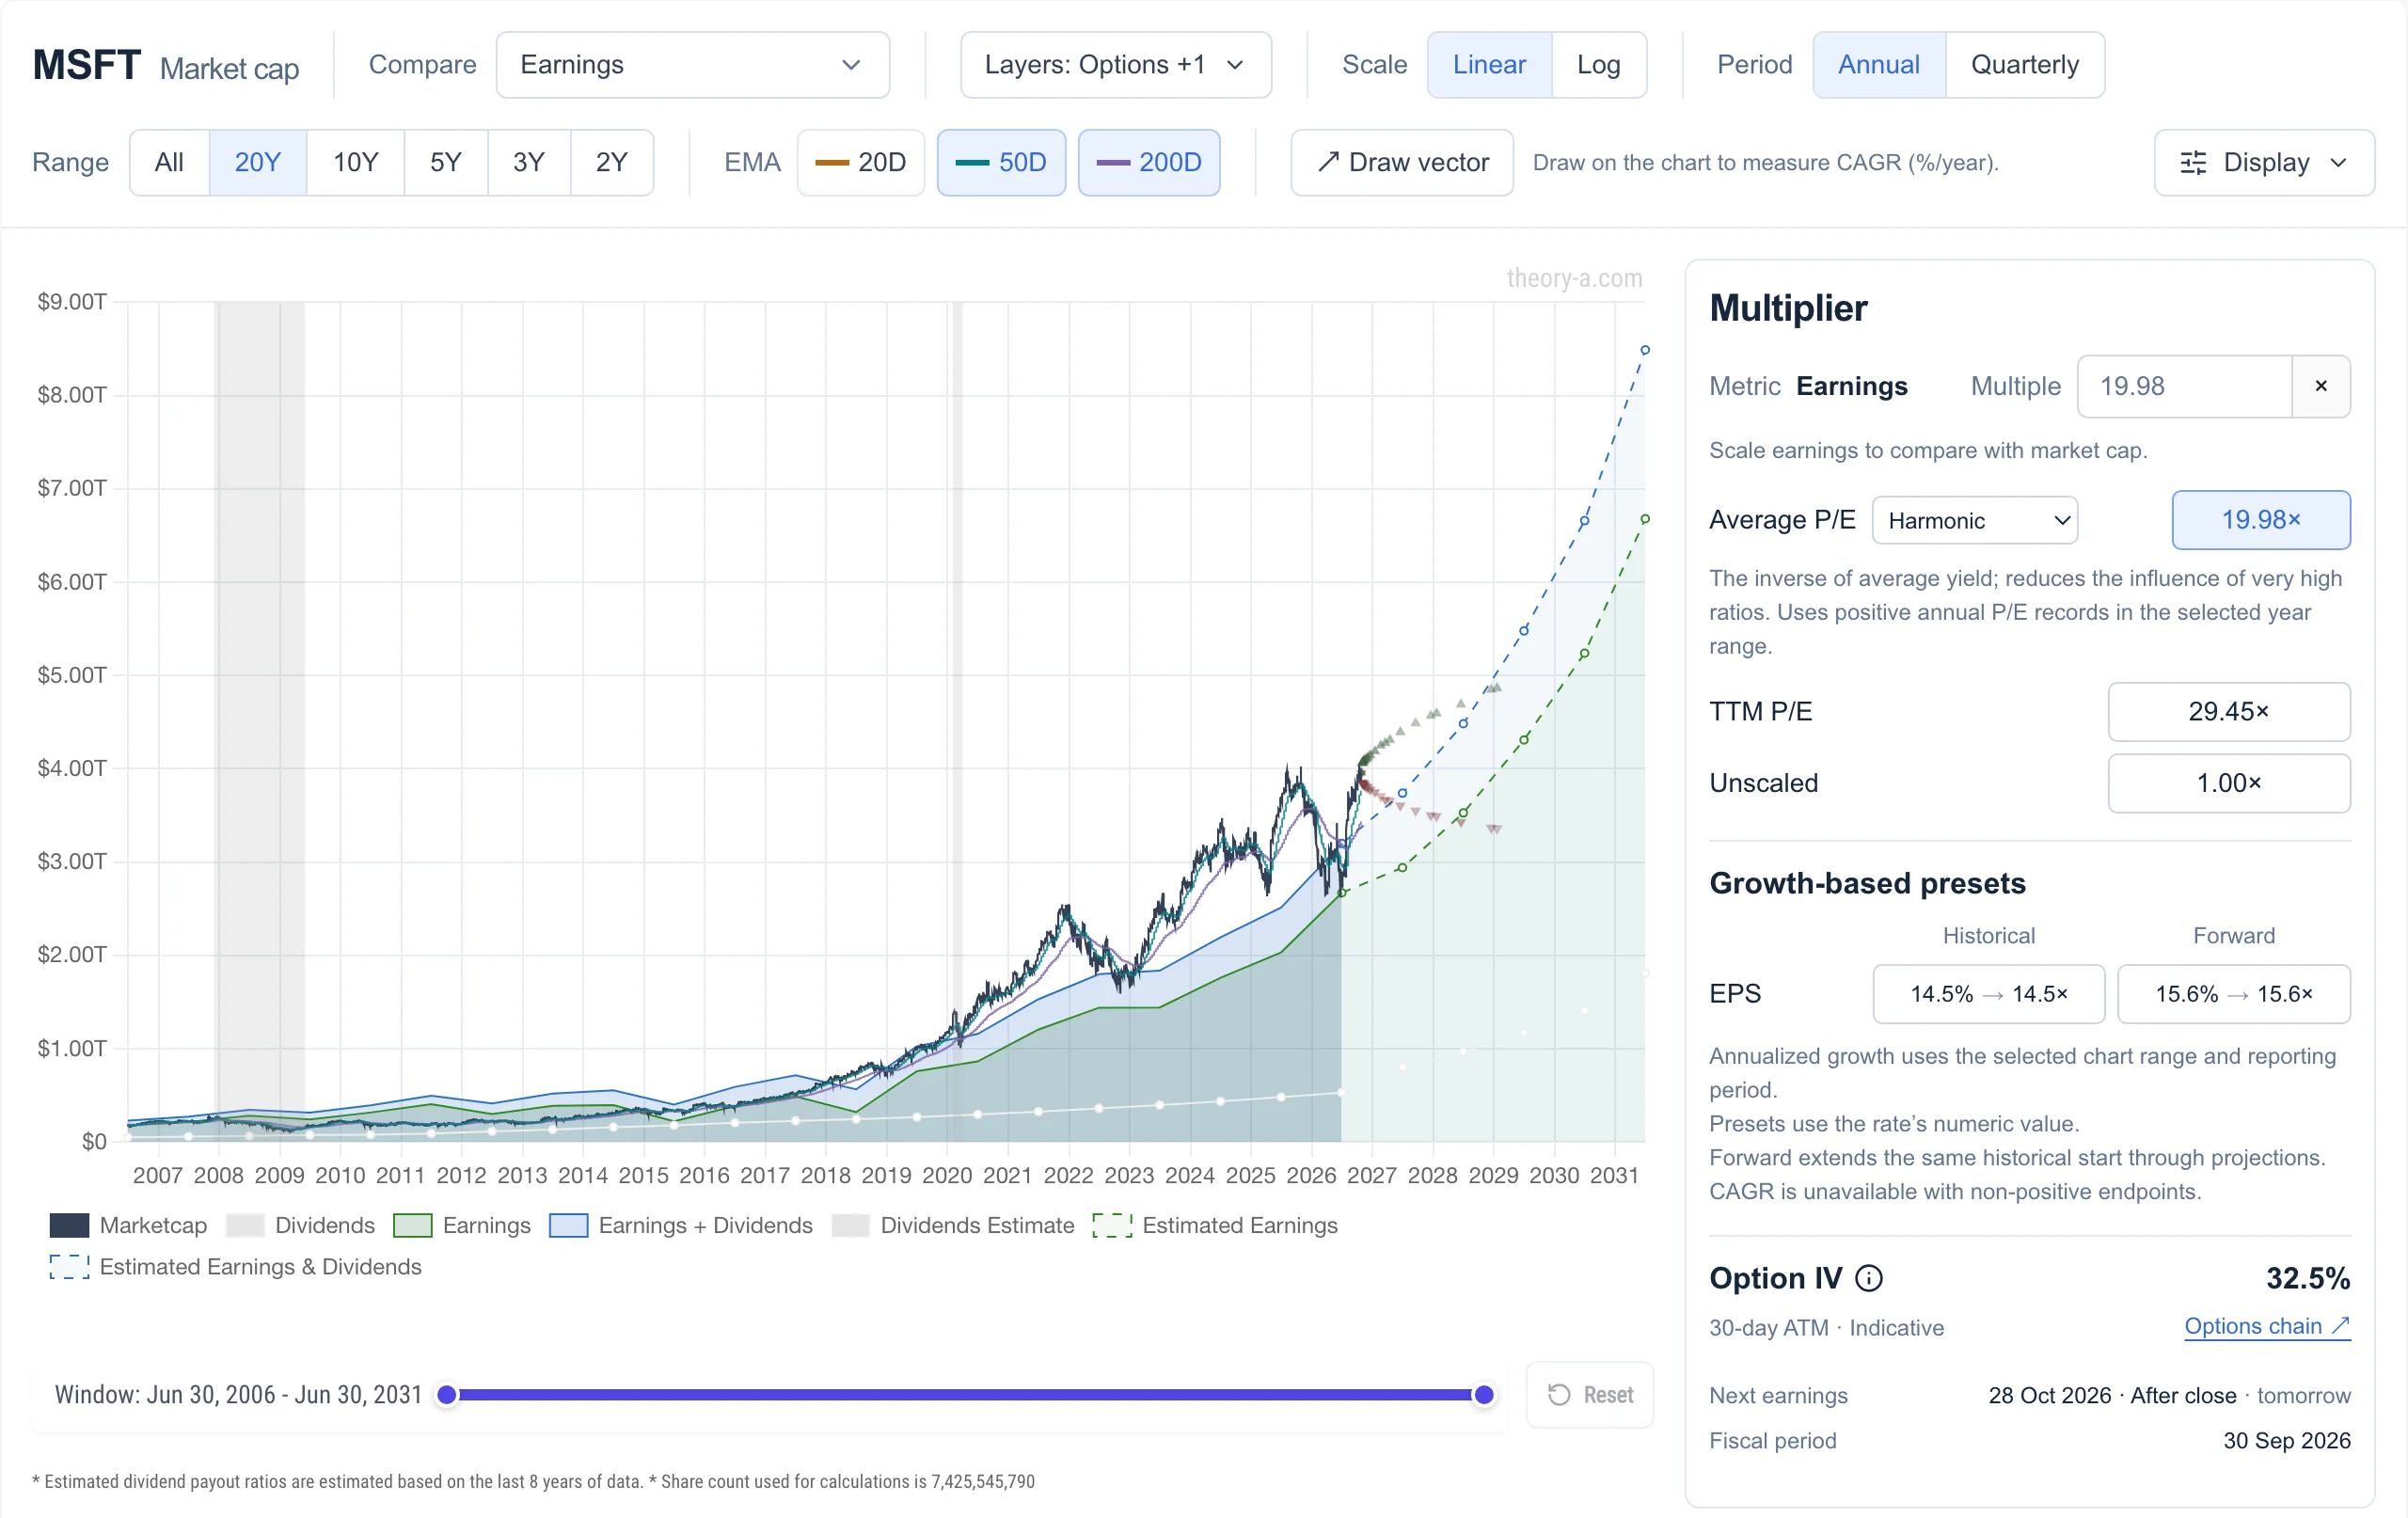 View full-size chart
Two ways to chart price against earnings
Stock Rover’s price-versus-fundamental chart starts the price and earnings lines at the same point and shows how far each has moved since. Theory A scales earnings by a multiple instead, so the green area marks where the price would sit at that P/E.
The difference shows up when a stock was expensive at the start. On an indexed chart it looks fairly valued whenever the two lines move together, because the starting premium is built in. A line set to the stock’s average P/E measures every year against that average, so an early premium shows as a gap from the first year.
Stock Rover and Theory A compared
Stock Rover goes deeper on screening, portfolios and reports. Theory A goes deeper on one question: is the price fair for the business you get?
| Feature | Theory A | Stock Rover |
|---|---|---|
| Screener | 36 free metrics with decile rankings | Hundreds of metrics, weighted ranking and a large library of ready-made screens |
| Ranking | A decile rank on each metric among about 5,900 US stocks | Stock Ratings: a percentile rank within the company’s industry group |
| Valuation | Price over earnings at the stock’s average P/E, or any multiple you set | DCF fair value with a margin of safety |
| Price vs earnings chart | Market cap over earnings × a multiple, across up to 30 years | Price and EPS lines from a common start, and P/E history |
| Portfolio | Positions, price alerts and an options journal | Brokerage linking, analytics, rebalancing and dividend projections |
| Research reports | Not offered | Printable reports on thousands of stocks |
| Options | Option chain with live Greeks, and breakevens on the earnings chart | Options chain and options metrics |
| Coverage | US, mainland China and Hong Kong stocks | North American stocks, ETFs and mutual funds |
Every metric ranked against every stock
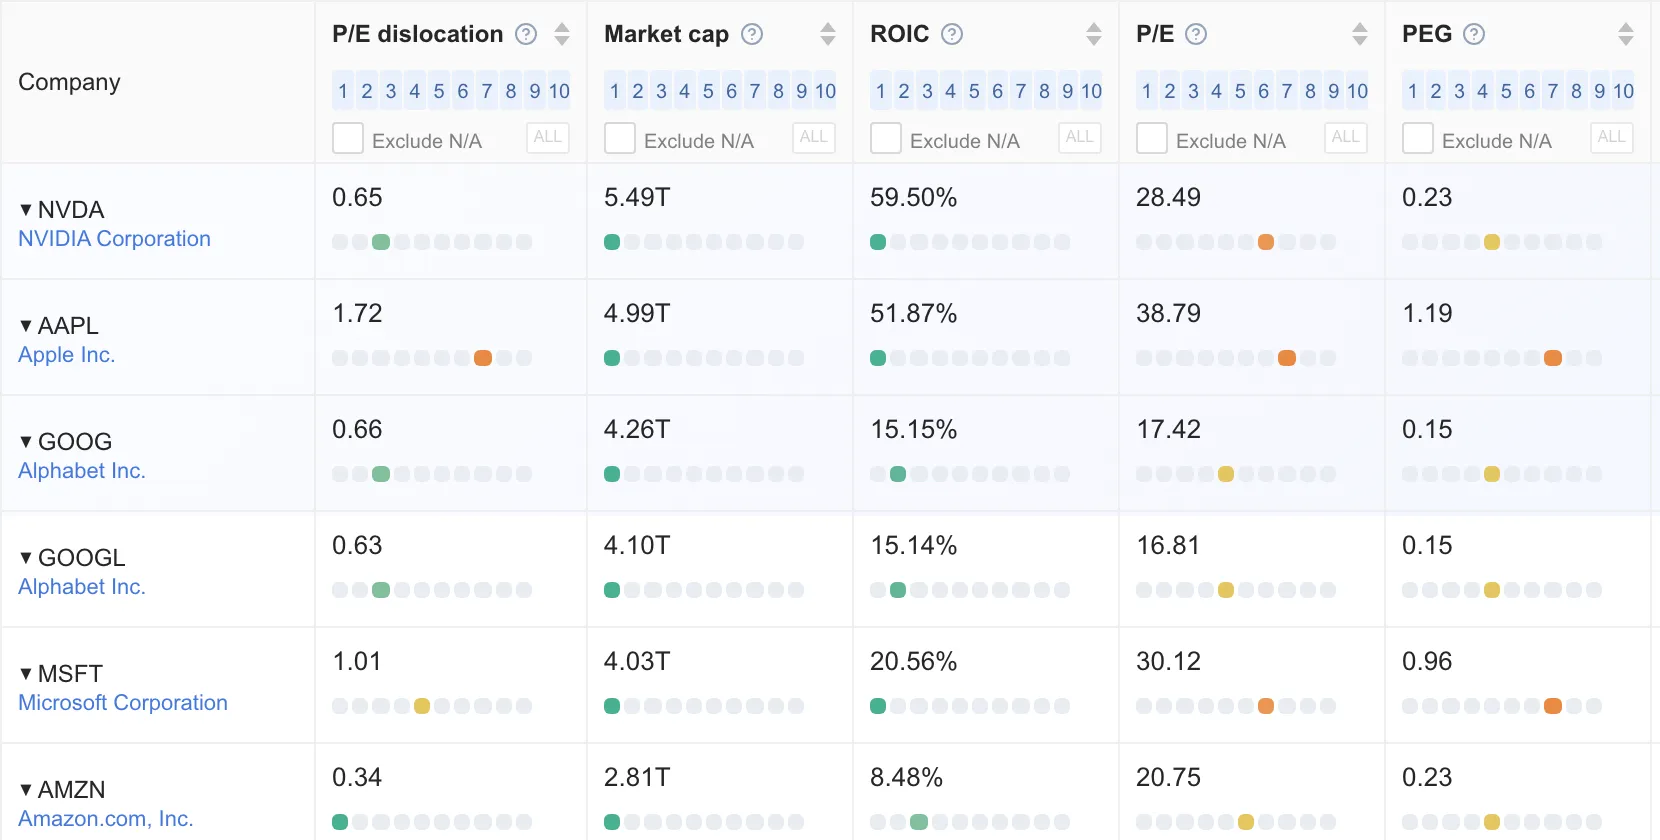
Stock Rover’s ratings rank a company within its industry group. Theory A’s screener ranks each metric among all of about 5,900 US stocks, so a P/E in the cheapest decile is cheap against the whole market. One of those metrics, P/E dislocation, compares each stock’s P/E with its own long-run average.
Which tool fits you
- Stock Rover, if you want hundreds of screening metrics, portfolio analytics on linked brokerage accounts, printable research reports, or Canadian stocks and funds.
- Theory A, if you want to see a company’s price against its business on one chart, a screener that ranks each metric against every US stock, and option breakevens beside your valuation.
Screen, then chart
Sort the screener by P/E dislocation, then open the cheapest names on the analyze page to see whether earnings explain the discount. Neither needs an account. See what Premium adds.
Open the screener →Stock Rover, FAST Graphs, GuruFocus, Macrotrends and Simply Wall St are trademarks of their respective owners. Theory A is not affiliated with or endorsed by any of them. Theory A is a research tool and does not provide investment advice.