
Simply Wall St alternative
See the history behind the valuation.
Instead of one fair-value number, see every year of a stock’s price against its earnings, at its own average P/E, free.
Simply Wall St sums a company up in a Snowflake score and a discounted cash flow fair value. Theory A, built to visualize value investing, takes the opposite approach for about 5,900 US stocks: it charts up to 30 years of price against earnings, so the assumptions sit on the chart rather than inside a model.
Chart Apple free →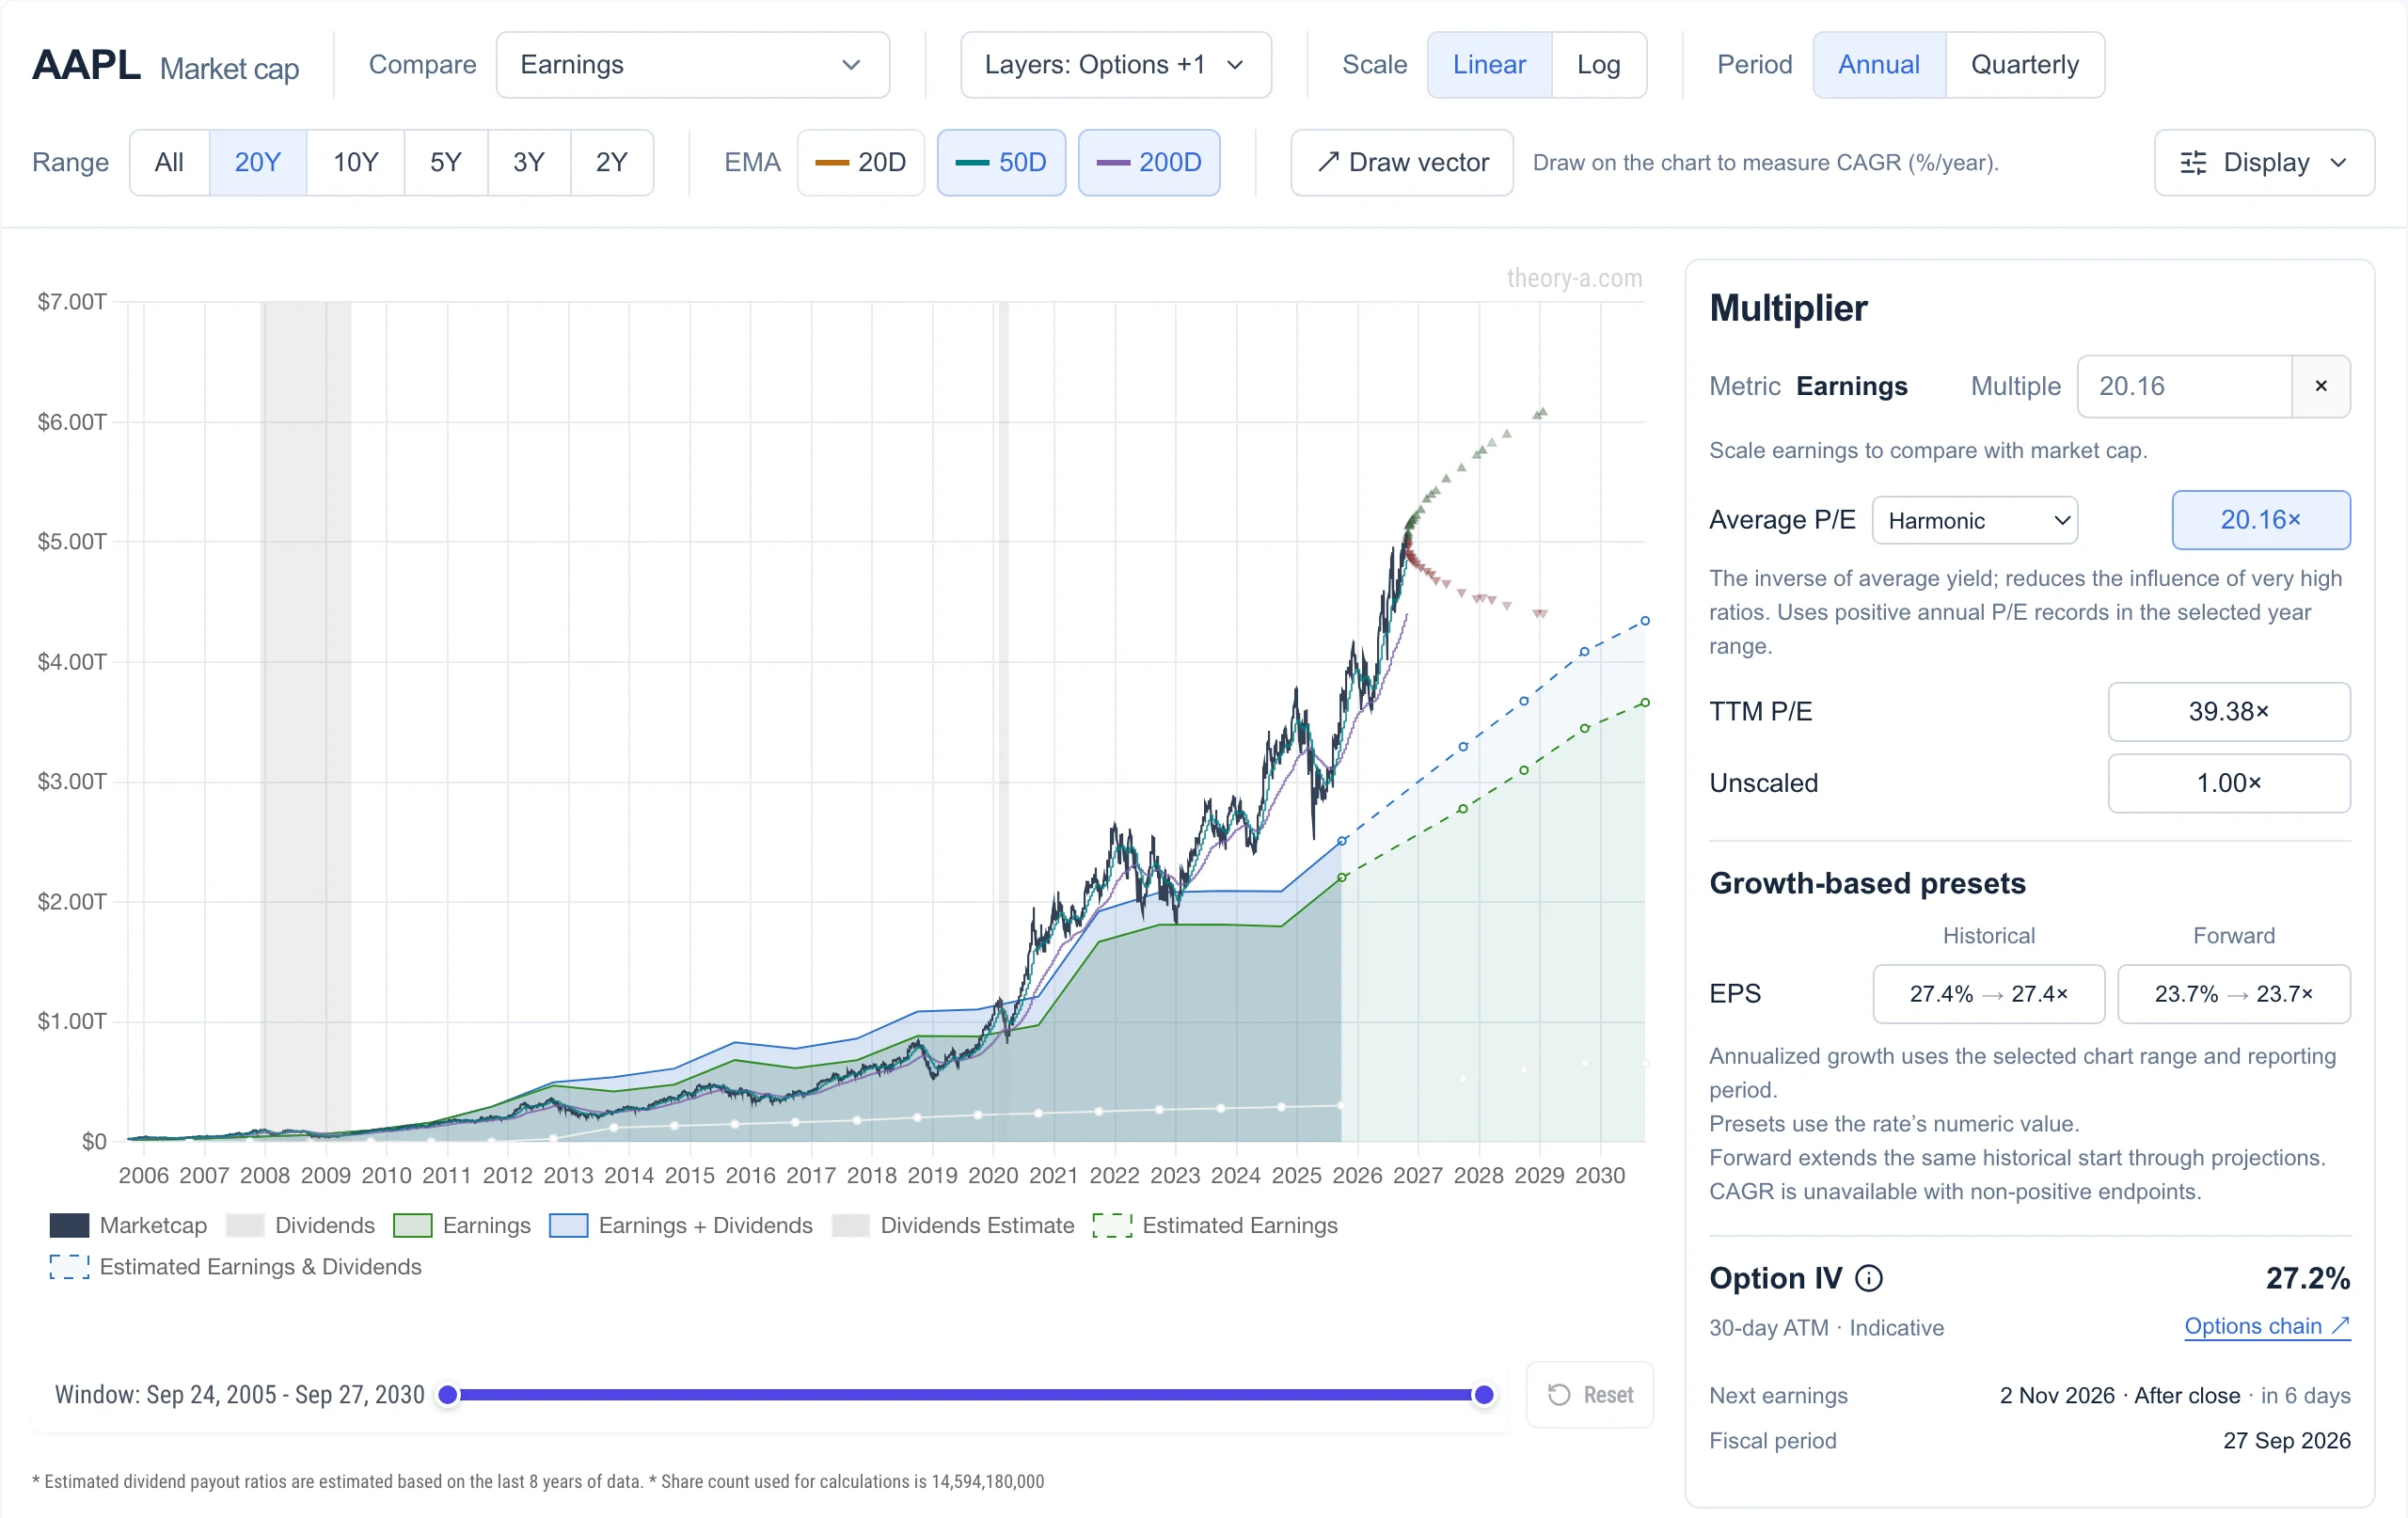 View full-size chart
A fair value, or a fair multiple
A discounted cash flow model turns a growth forecast and a discount rate into one number. Small changes to either can move that number a long way, and a single number can’t show how the market has actually priced the business over the years.
Theory A asks a different question: what multiple of earnings has the market paid for this business, and what does today’s price assume? Apple has averaged 20× earnings over 20 years and trades at 39× today, so earnings would need to roughly double for the price to hold if the P/E returned to its average. As of October 27, 2026, analyst estimates extended to 2030 at that average multiple still sit below today’s market cap.
You can test other answers. Type any multiple, or pick a preset based on historical or forecast earnings growth, and the line moves with it.
Simply Wall St and Theory A compared
Simply Wall St condenses a company into scores and summaries across global markets. Theory A is narrower: it puts the price, the business and the options market on one chart.
| Feature | Theory A | Simply Wall St |
|---|---|---|
| Valuation | Price over earnings at the stock’s average P/E, or any multiple you set | Discounted cash flow fair value, shown as a percentage above or below the price |
| P/E in context | Compared with the stock’s own history, and ranked among about 5,900 US stocks | Compared with peers, the industry and a forecast-based fair ratio |
| Scores | A decile rank on each metric | Snowflake: five areas, six pass-or-fail checks each |
| Your own assumptions | Type a multiple, or extend it along analyst estimates | Narratives: set revenue growth, margins, future P/E and a discount rate |
| Portfolio | Positions, price alerts and an options journal | Broker sync, returns and dividend income |
| Options | Option chain with live Greeks, and breakevens on the earnings chart | Not the focus |
| Coverage | US, mainland China and Hong Kong stocks | Global |
When earnings don’t tell the story
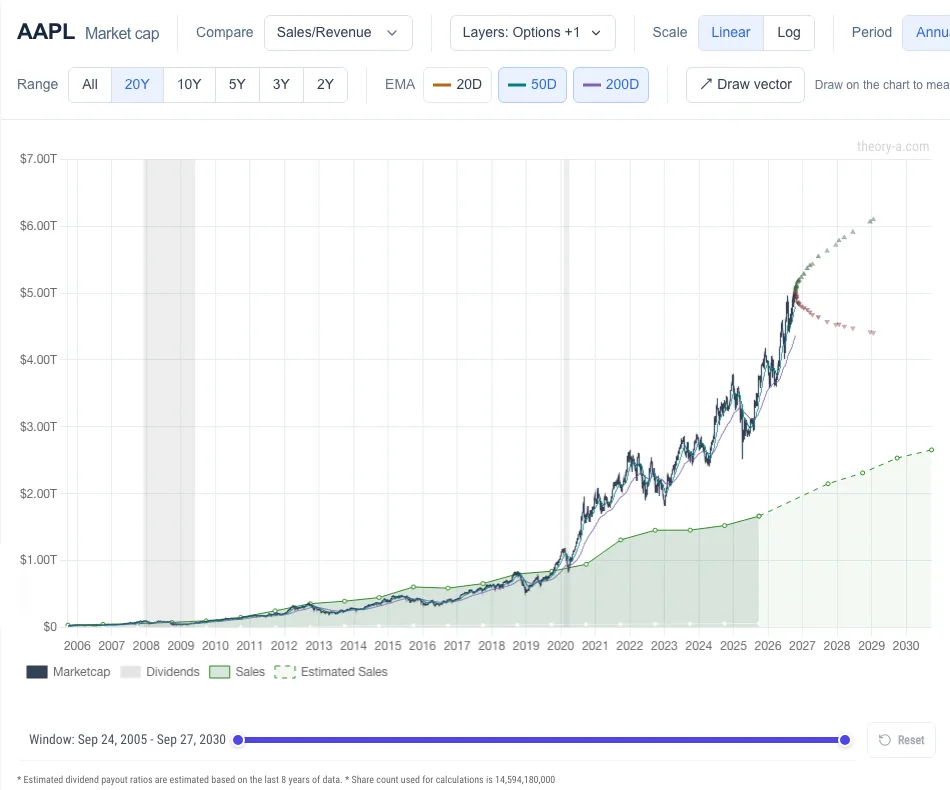
The same chart can compare price with sales, book value or operating cash flow. That helps with companies whose earnings are small, negative or distorted by one-off charges.
Which tool fits you
- Simply Wall St, if you want a quick visual summary of a company, a ready-made fair value, broker sync for your portfolio, or global coverage.
- Theory A, if you want to see the price history behind a valuation, compare a P/E with the stock’s own past, and weigh shares against options on the same chart.
Try it on a stock you own
Open any ticker on the analyze page and find the year the price left the earnings line. Then type a multiple to see what P/E today’s price assumes. The earnings chart needs no account. See what Premium adds.
Open the stock analyzer →Simply Wall St, FAST Graphs, GuruFocus, Macrotrends and Stock Rover are trademarks of their respective owners. Theory A is not affiliated with or endorsed by any of them. Theory A is a research tool and does not provide investment advice.