
Macrotrends alternative
A stock’s P/E history, in one picture.
Chart a stock’s price over its earnings at its own average P/E, across up to 30 years of history, free.
Macrotrends lists a stock’s P/E quarter by quarter, next to its price and trailing earnings. Theory A, built to visualize value investing, draws the same numbers as one chart for about 5,900 US stocks: market cap over earnings scaled by the stock’s average P/E. The years when the price ran ahead of the business stand out at a glance.
Chart Costco free →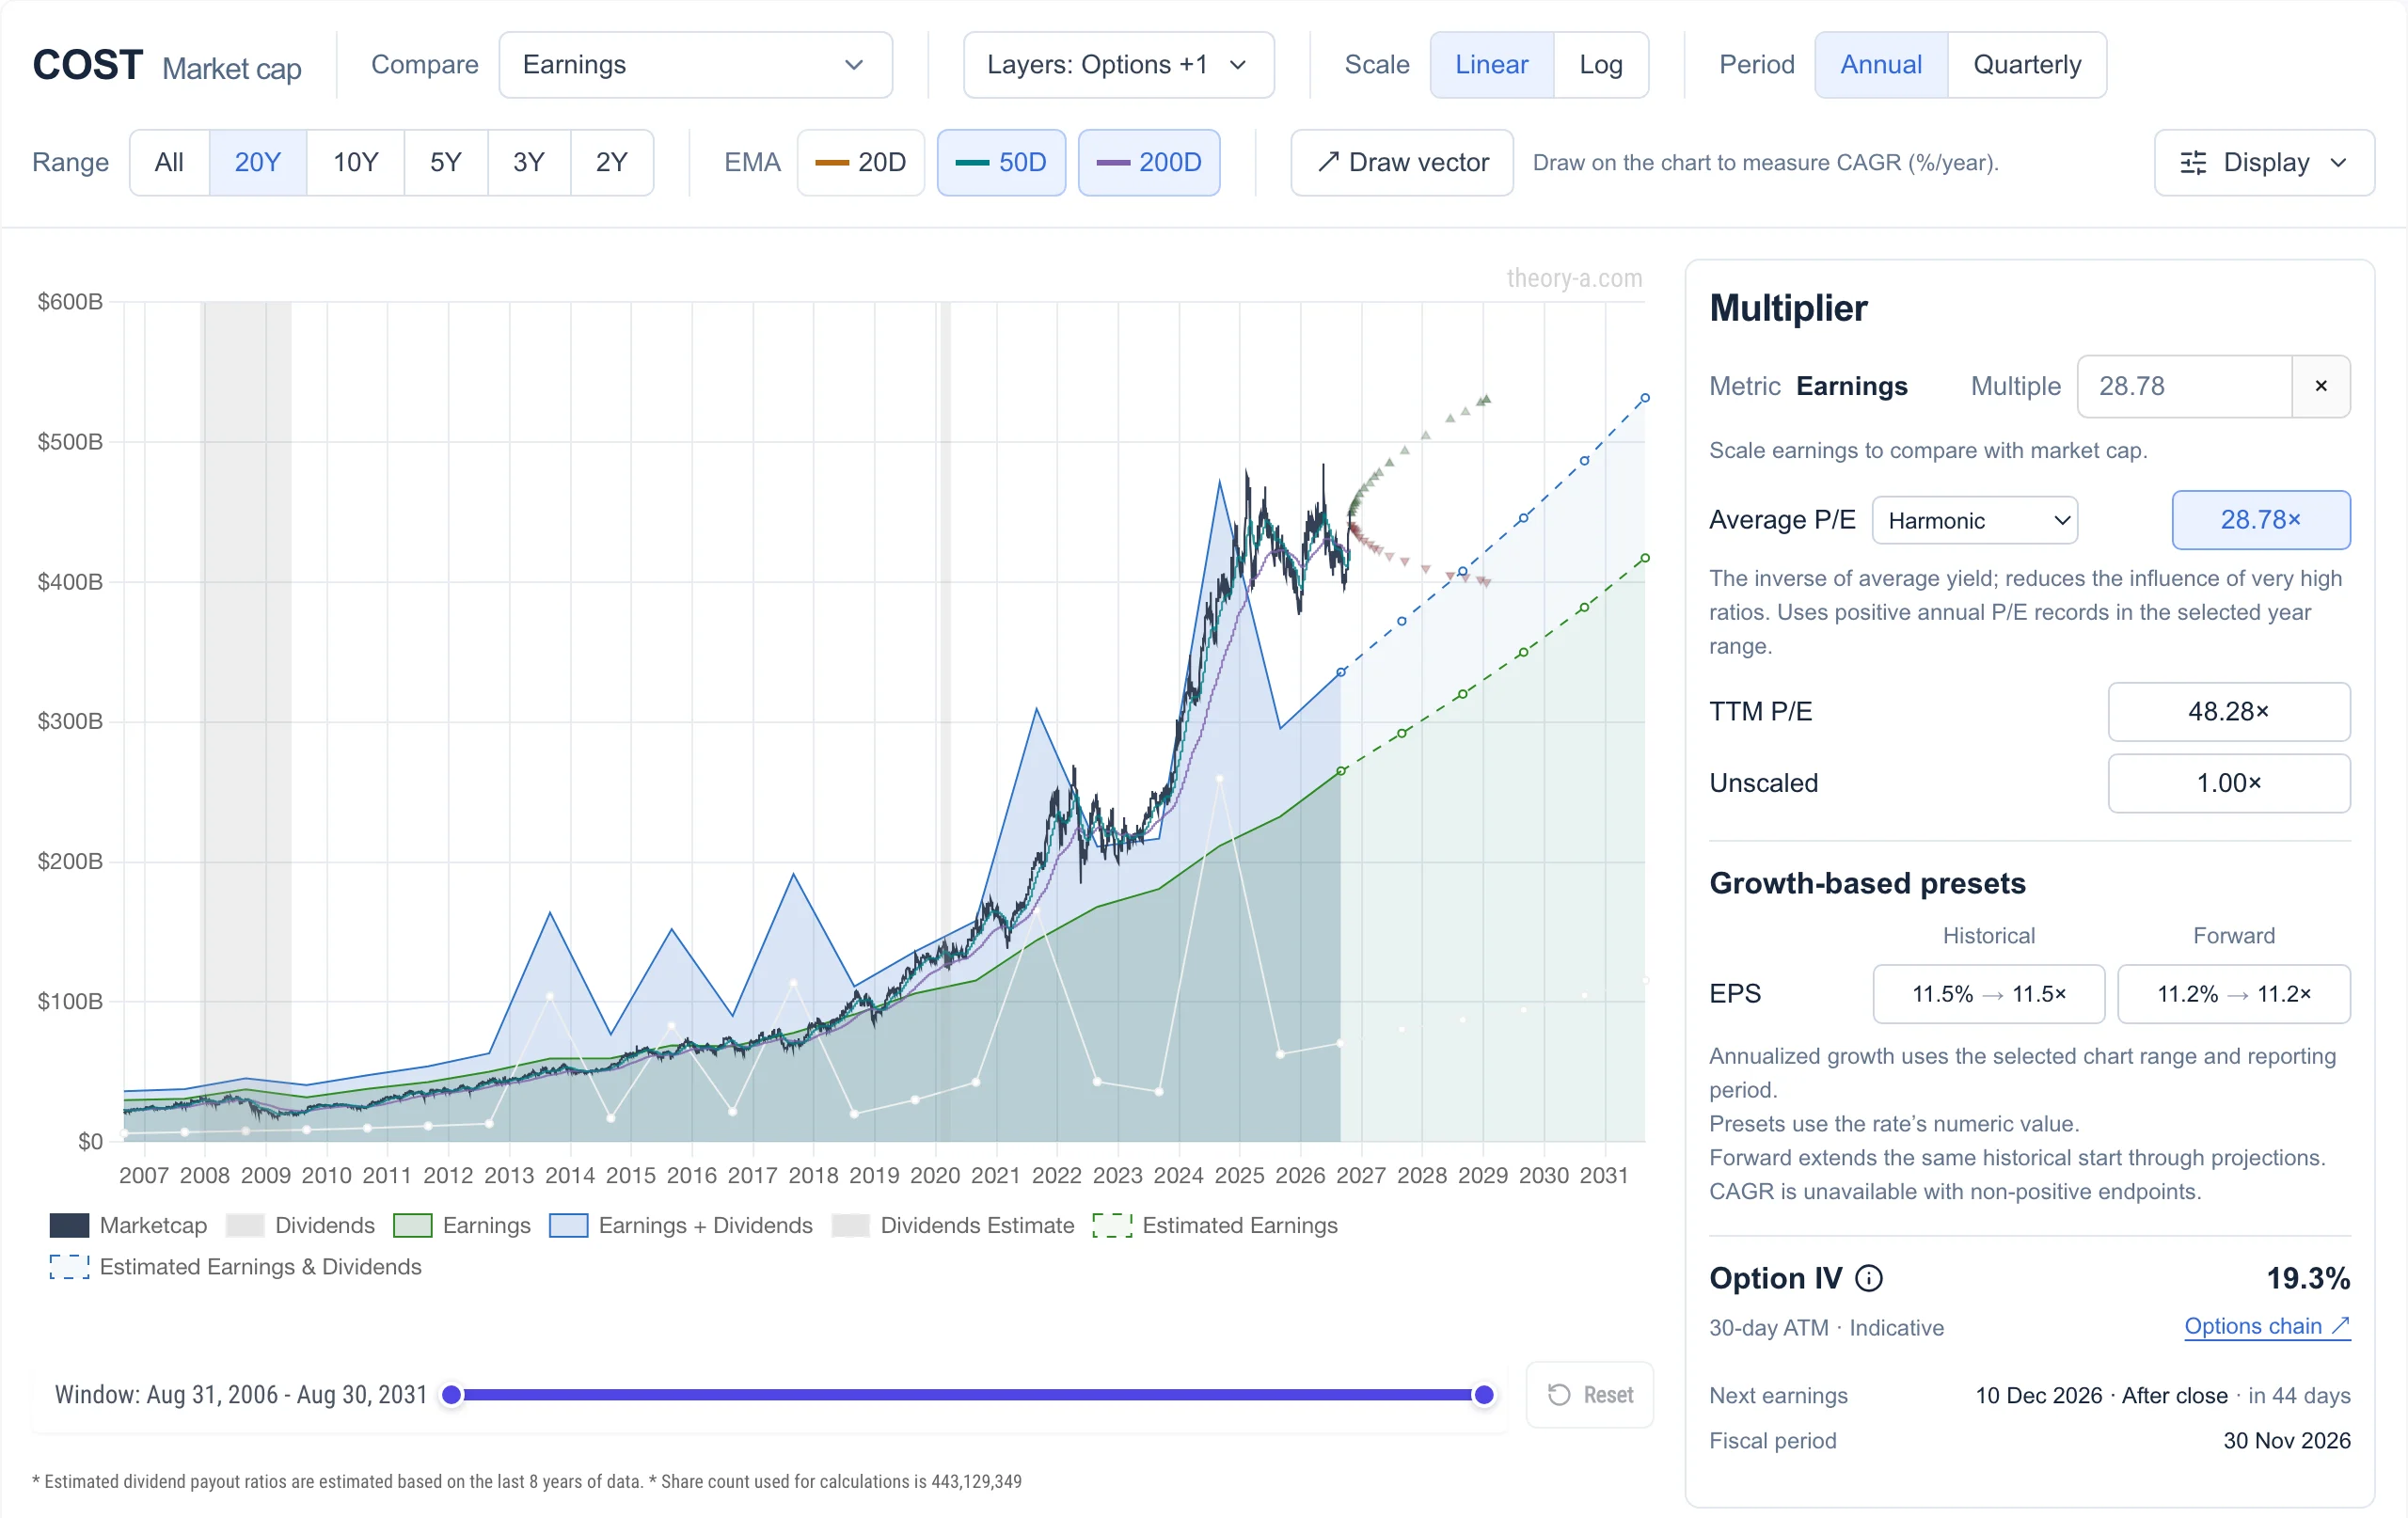 View full-size chart
Reading P/E history as a chart
A P/E table tells you the ratio was 48 this quarter and 29 on average. The chart shows what that means: when the dark line sits above the green area, the stock trades above its average P/E, and the gap between them is how far the price would fall if the P/E returned to its average while earnings stood still.
- The average can be arithmetic, geometric, harmonic, median or least squares, over the range you pick: from 2 years to the stock’s whole history of up to 30 years. Harmonic averaging keeps one year of tiny earnings from inflating the result.
- Theory A uses reported net income, so one-off charges appear as dips instead of being smoothed away.
- Analyst estimates continue the earnings line as dashed lines, so you can see how long earnings would take to catch up with today’s price.
Macrotrends and Theory A compared
Macrotrends is a deep library of long-run data, for companies and for whole economies. Theory A is narrower: it puts the price, the business and the options market on one chart.
| Feature | Theory A | Macrotrends |
|---|---|---|
| P/E history | Price drawn over earnings at the stock’s average P/E, with five ways to average | P/E by quarter, beside price and trailing earnings per share |
| Company financials | Free price comparisons against earnings, sales, book value or cash flow | Income statement, balance sheet, cash flow, margins and ratios |
| Screener | 36 metrics with decile rankings, including P/E against the stock’s own history | Dozens of fundamental and performance filters |
| Markets and economy | Not the focus | Long-run charts of indexes, commodities, rates and economies |
| Coverage | US, mainland China and Hong Kong stocks | US-listed stocks, including ADRs |
Find stocks below their own P/E history
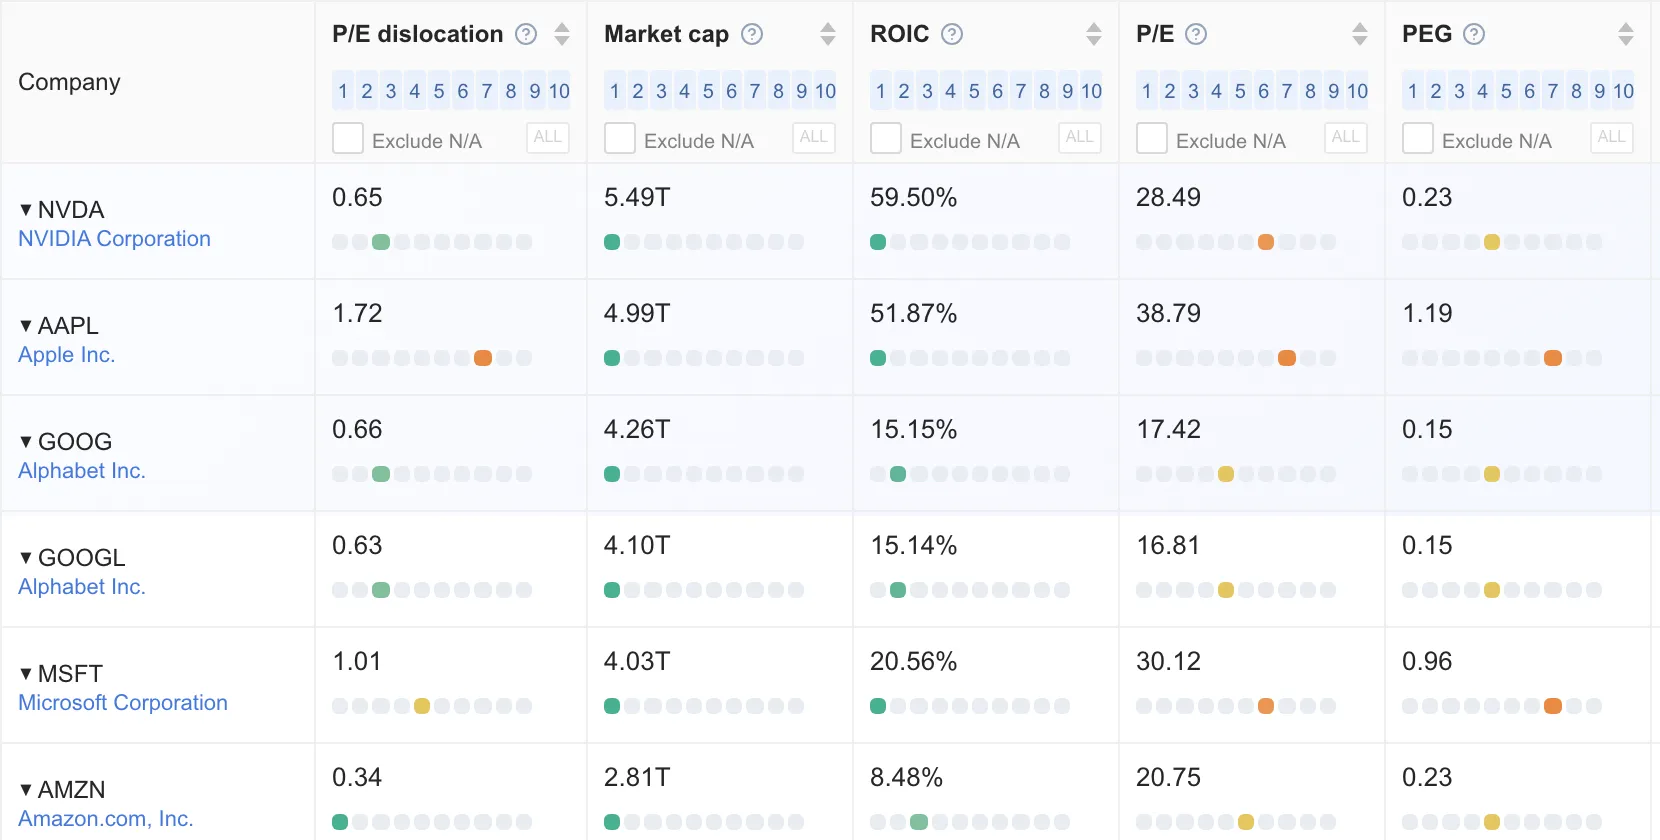
The screener’s P/E dislocation metric divides each stock’s trailing P/E by its long-run average, then ranks the result among about 5,900 US stocks. A value below 1 means the stock is cheaper than it has usually been. That turns P/E history from something you look up one stock at a time into something you can search across the market.
Which tool fits you
- Macrotrends, if you want long-run charts of markets, commodities and economies, or a company’s financial statements laid out year by year.
- Theory A, if you want to see at a glance whether a price has run ahead of the business, search the market for stocks below their own P/E history, or check what the options market implies.
Try it on a stock you own
Open Costco on the analyze page and switch the average between harmonic, median and least squares to see how much the line moves. Then sort the screener by P/E dislocation. Neither needs an account. See what Premium adds.
Open the screener →Macrotrends, FAST Graphs, GuruFocus, Simply Wall St and Stock Rover are trademarks of their respective owners. Theory A is not affiliated with or endorsed by any of them. Theory A is a research tool and does not provide investment advice.